THEME PARKS
Following a period of growth in 2015, the world’s top theme parks have experienced a mixed year, according to the latest edition of the TEA/AECOM Theme Index report.
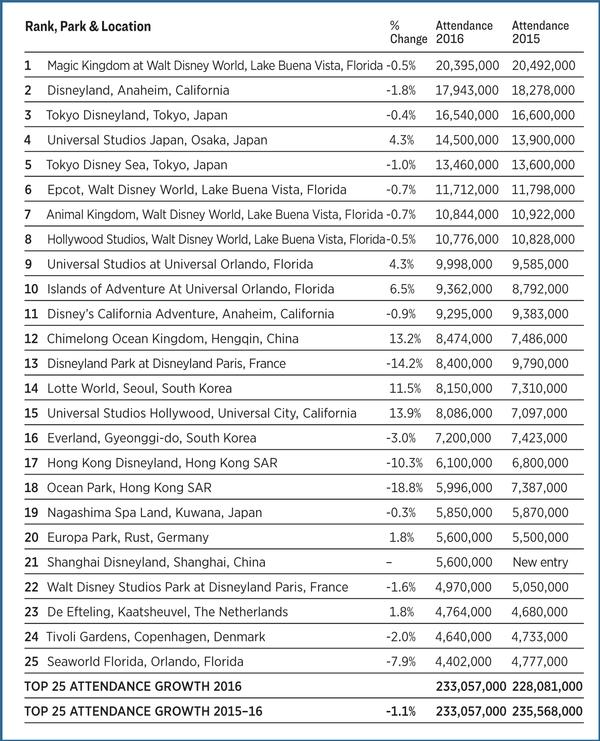
For the world’s top 25 theme parks, attendance declined 1.1 per cent, down from 235.6 million visitors in 2015 to 233.1 million in 2016, with the top operator – Disney – telling a similar story.
Mouse trap?
According to the 2016 Index, which marks the 11th edition of the report, overall attendance at Disney attractions was, in fact, up by 2.5 million, although this was, in part, a result of the Shanghai Disney Resort launch, which recorded visitor numbers of 5.6 million in its debut year.
Florida’s Magic Kingdom remains the world’s most visited park, with Disneyland California and Tokyo Disneyland in second and third place, respectively. All three parks suffered attendance declines however, with drops of 0.5 per cent, 1.8 per cent and 0.4 per cent, respectively.
In 2016, Magic Kingdom welcomed 20.4 million visitors, while Disneyland California drew 17.9 million and Tokyo Disneyland attracted 16.5 million. Other Disney parks included in the Index all recorded attendance declines, the largest being a 10.3 per cent drop at Hong Kong Disneyland, which lost 700,000 visitors to welcome 6.1 million visitors.
Universal approval
Other operators have fared better than Disney, with Universal Studios recording attendance increases at all of its parks, buoyed by new attractions and IPs, including the continued success of its Harry Potter worlds and attractions.
Universal Studios Japan was ranked fourth for attendance overall, with visitor numbers increasing from 13.9 million in 2015 to 14.5 million in 2016 – a 4.3 per cent increase. Universal Studios in Orlando also saw its numbers surge by the same percentage, up from 9.6 million to 10 million. The neighbouring Islands of Adventure park in Orlando increased numbers by 6.5 per cent from 8.8 million to 9.4 million during the period.
Universal Studios Hollywood launched its new Wizarding World of Harry Potter attraction in April 2016, with the boy wizard’s magic spell once again driving park attendance – up 13.9 per cent year-on-year, from 7.1 million to 8.1 million.
An eye on Asia
“Disney resources have lately been concentrated in Asia, with Shanghai Disney Resort having opened in mid-2016,” says Brian Sands, vice president of economics, the Americas, for AECOM. “Meanwhile, Universal’s Harry Potter attractions have been a powerful draw in both Hollywood and Orlando. But Disney has new IP magic of its own in its North American parks, most notably the Pandora land (Avatar) at Disney’s Animal Kingdom, as well as the redesigned and renamed Disney Springs retail-dining-entertainment area. For its part, Universal is also continuing to grow domestically, with its new second gate in Orlando – Volcano Bay.”
Group dominance
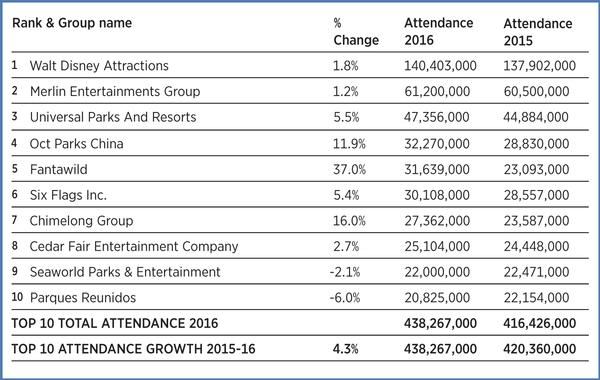
For the world’s top 10 theme park groups, overall attendance was up 4.3 per cent, with numbers rising from 420.4 million in 2015 to 438.3 million in 2016. Walt Disney Attractions holds a substantial lead over second-placed Merlin Entertainments, with 140.4 million visitors in 2016 for Disney’s parks, compared with 61.2 million for all Merlin’s theme park operations worldwide. Universal Parks and Resorts places third, with 47.35 million visitors.
In terms of attendance, Chinese operator Fantawild, which opened two theme parks in 2015, had the largest increase, with a 37 per cent jump from 23.1 million in 2015 to 31.7 million in 2016.
Out of the top 10 group operators, SeaWorld Parks & Entertainment and Parques Reunidos were the only two groups to record a decline, with drops of 2.1 per cent and 6 per cent, respectively.
WATERPARKS
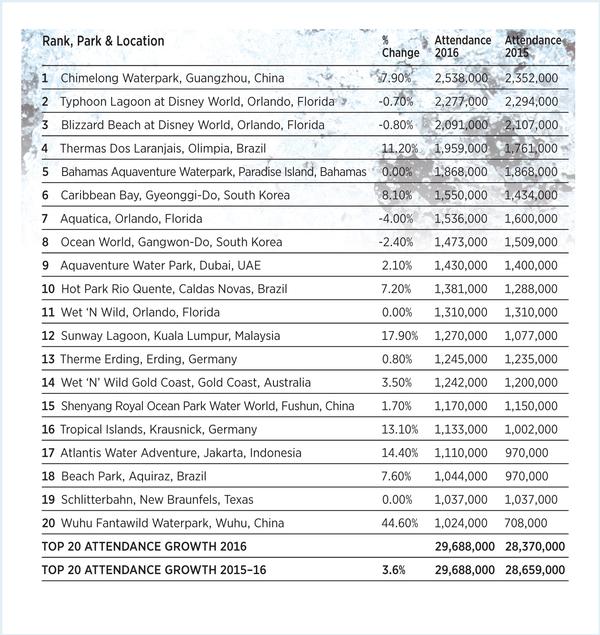
Waterparks worldwide enjoyed a fruitful 2016, with combined attendance among the top 20 increasing to nearly 30 million.
The waterparks sector performed particularly strongly in Asia last year, with 6.9 per cent overall growth in 2016.
Elsewhere, due to ongoing macro-economic challenges, a boost in domestic tourism meant fewer Brazilians travelled to Orlando, a market that Florida has traditionally counted on for attendance.
However, some of Brazil’s attractions benefited from increased attendance. The economic climate combined with a facility expansion drove Olimpia’s Thermas Dos Laranjais waterpark to fourth in the overall list. During 2016, visitor numbers at the waterpark increased 11.2 per cent, totalling 1.96 million people.
Similar increases were seen at Brazil’s other listed waterparks, with 10th place Hot Park Rio Quente in Caldas Novas increasing attendance by 7.2 per cent to 1.38 million, and 18th place Beach Park in Aquiraz increasing 7.6 per cent to 1.04 million.
MUSEUMS
Growth among the global top 20 museums increased following a 0.7 per cent decline in 2015’s Museum Index, with a 1.2 per cent increase from 106.5 million visitors in 2015 to 107.8 million in 2016.
Since the first Museum Index was published in 2012, attendance globally has risen between 2 and 3 per cent, with Asia accounting for most of that growth.
“The US and European markets are mature, with approximately 1 per cent growth annually,” said the report. “In Asia, we have seen growth of 9 per cent annually over the past few years.”
Louvre loses top spot
The National Museum of China in Beijing is now the world’s most-visited museum, displacing the Louvre in Paris, which suffered a 14.9 per cent attendance drop.
Tourist numbers to Paris and other areas of France have suffered in the wake of multiple terrorist attacks in the country, marked by the attendance decline at the Louvre, which dropped from 8.7 million in 2015 to 7.4 million in 2016, which means the historic institution is now the world’s third-most visited museum.
Similarly in Paris, the Musée d’Orsay experienced a double-digit drop in attendance, falling 12.8 per cent to 3 million visitors, dropping outside of the top 20 from 17th position last year.
Recording an increase of 3.6 per cent year-on-year, 7.55 million people visited the National Museum of China. It took the number one spot, narrowly edging out the 7.5 million people who visited the National Air and Space Museum in Washington, DC.
The full TEA/AECOM Theme Index is available at teaconnect.org/Resources.