THEME PARKS
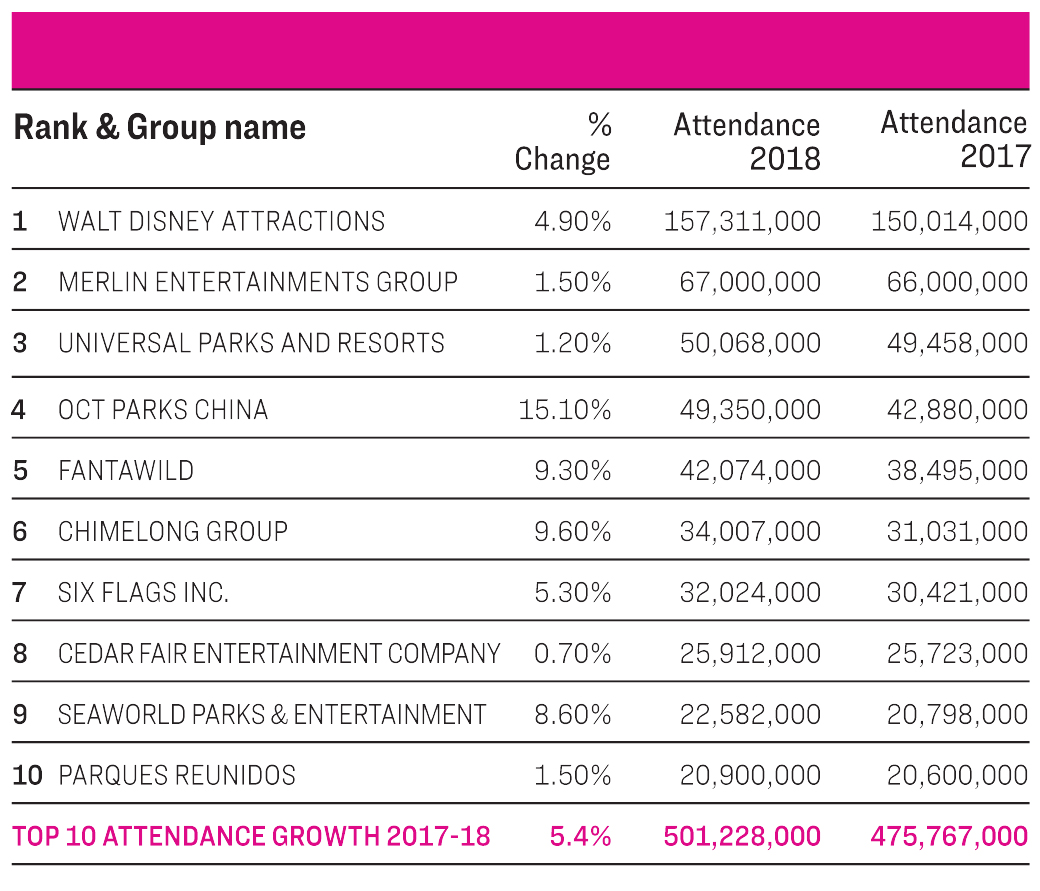
Marking a 5.4 per cent rise in global attendance across the world’s top 10 theme park operators. 501.2 million people visited major theme parks across the globe in 2018, with the rise representing a visitor increase of 25.4 million visitors.
Now exceeding half-a-billion people, almost 7 per cent of the entire global population visited a theme park in 2018. An impressive figure in its own right, this statistic is even more astounding when coupled with the fact that five years ago the market capture for theme parks was 5 per cent. In those five years, attendance among the big players has risen by 124 million.
Of the top 10 operators, OCT Parks China had the largest visitor percentage increase compared to 2017, with a 15.1 per cent rise to 49.35 million visitors.
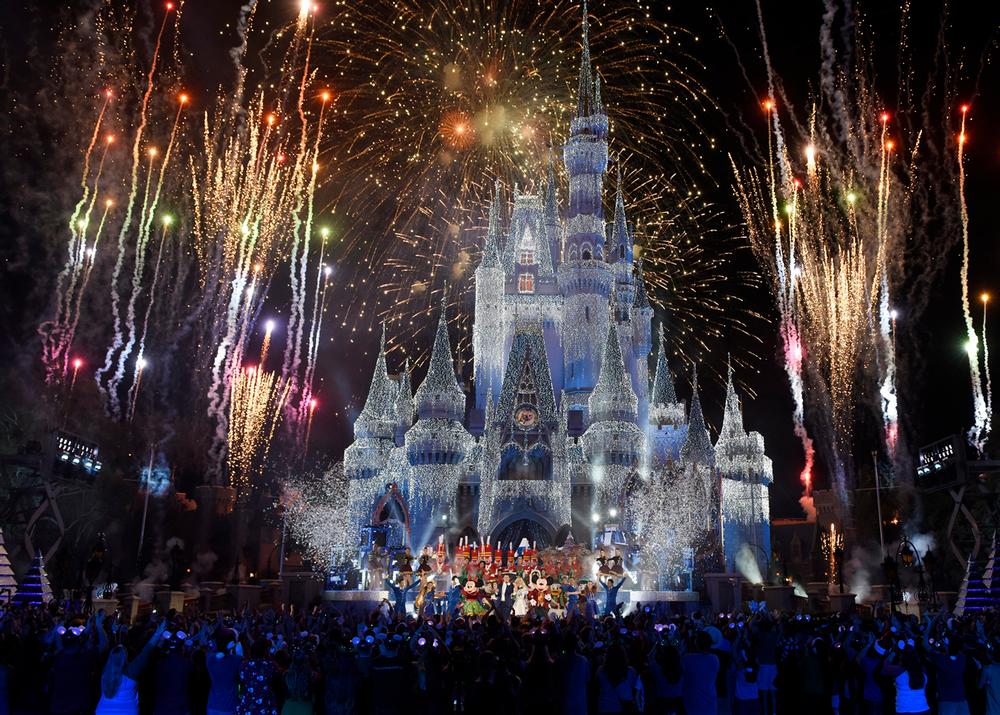
Disney remains king of the jungle, with its 157 million visitors for the year dwarfing second-placed Merlin, which welcomed 67 million visitors through 2018. Visitation at Disney increased by 4.9 per cent, while Merlin attendance rose by 1.5 per cent.
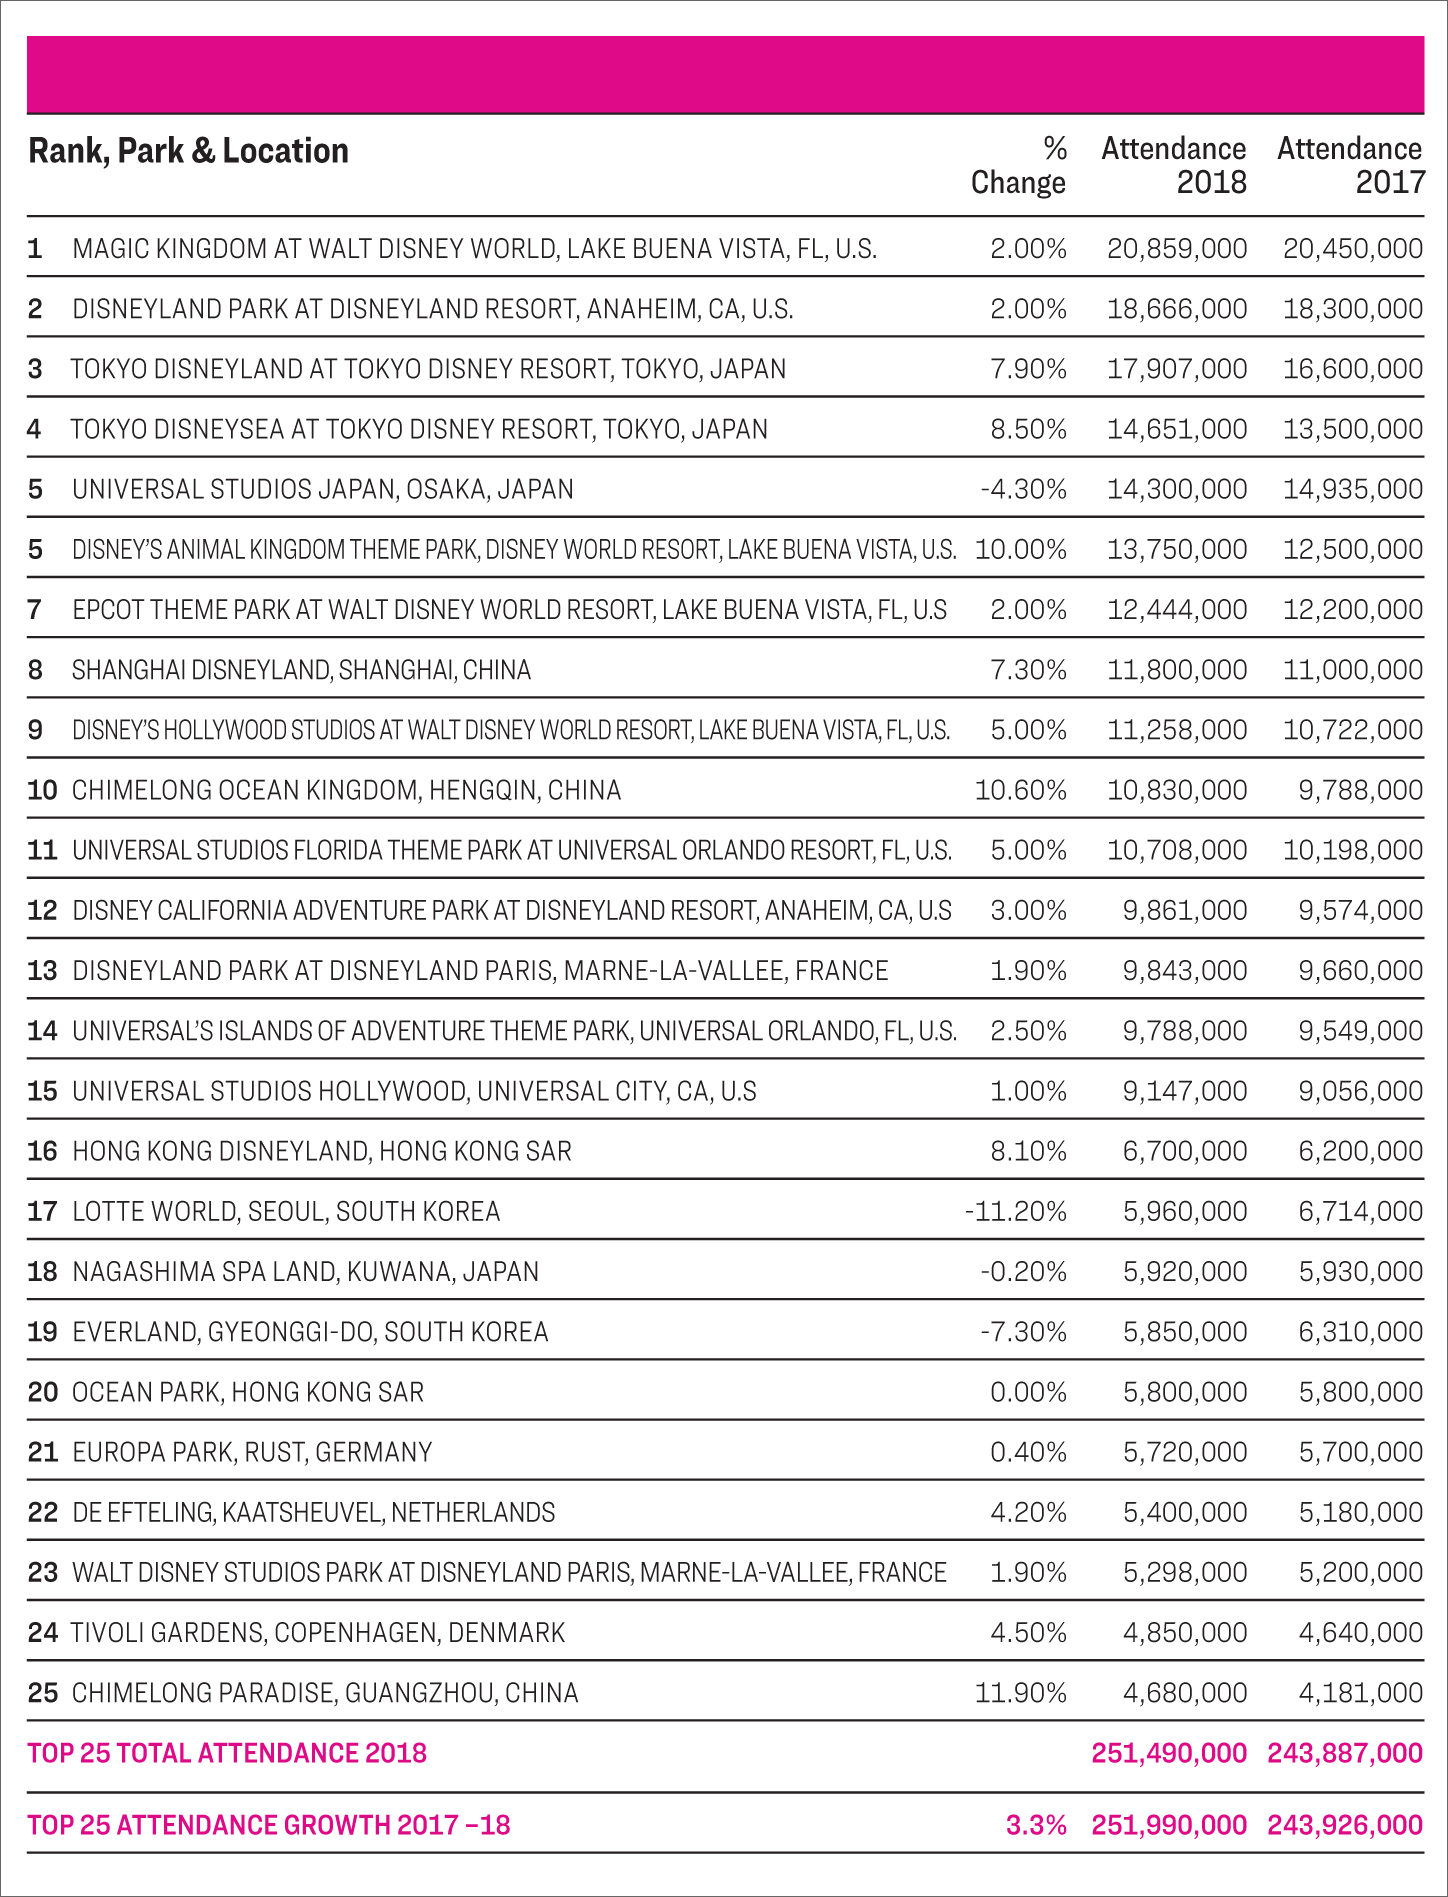
Disney’s Magic Kingdom remains the world’s most-attended theme park, with 20.86 million visitors marking a 2 per cent increase in attendance. Disney also occupies second through to fourth place on the list, with 11 of the top 25 theme parks in the world being Disney properties.
WATERPARKS
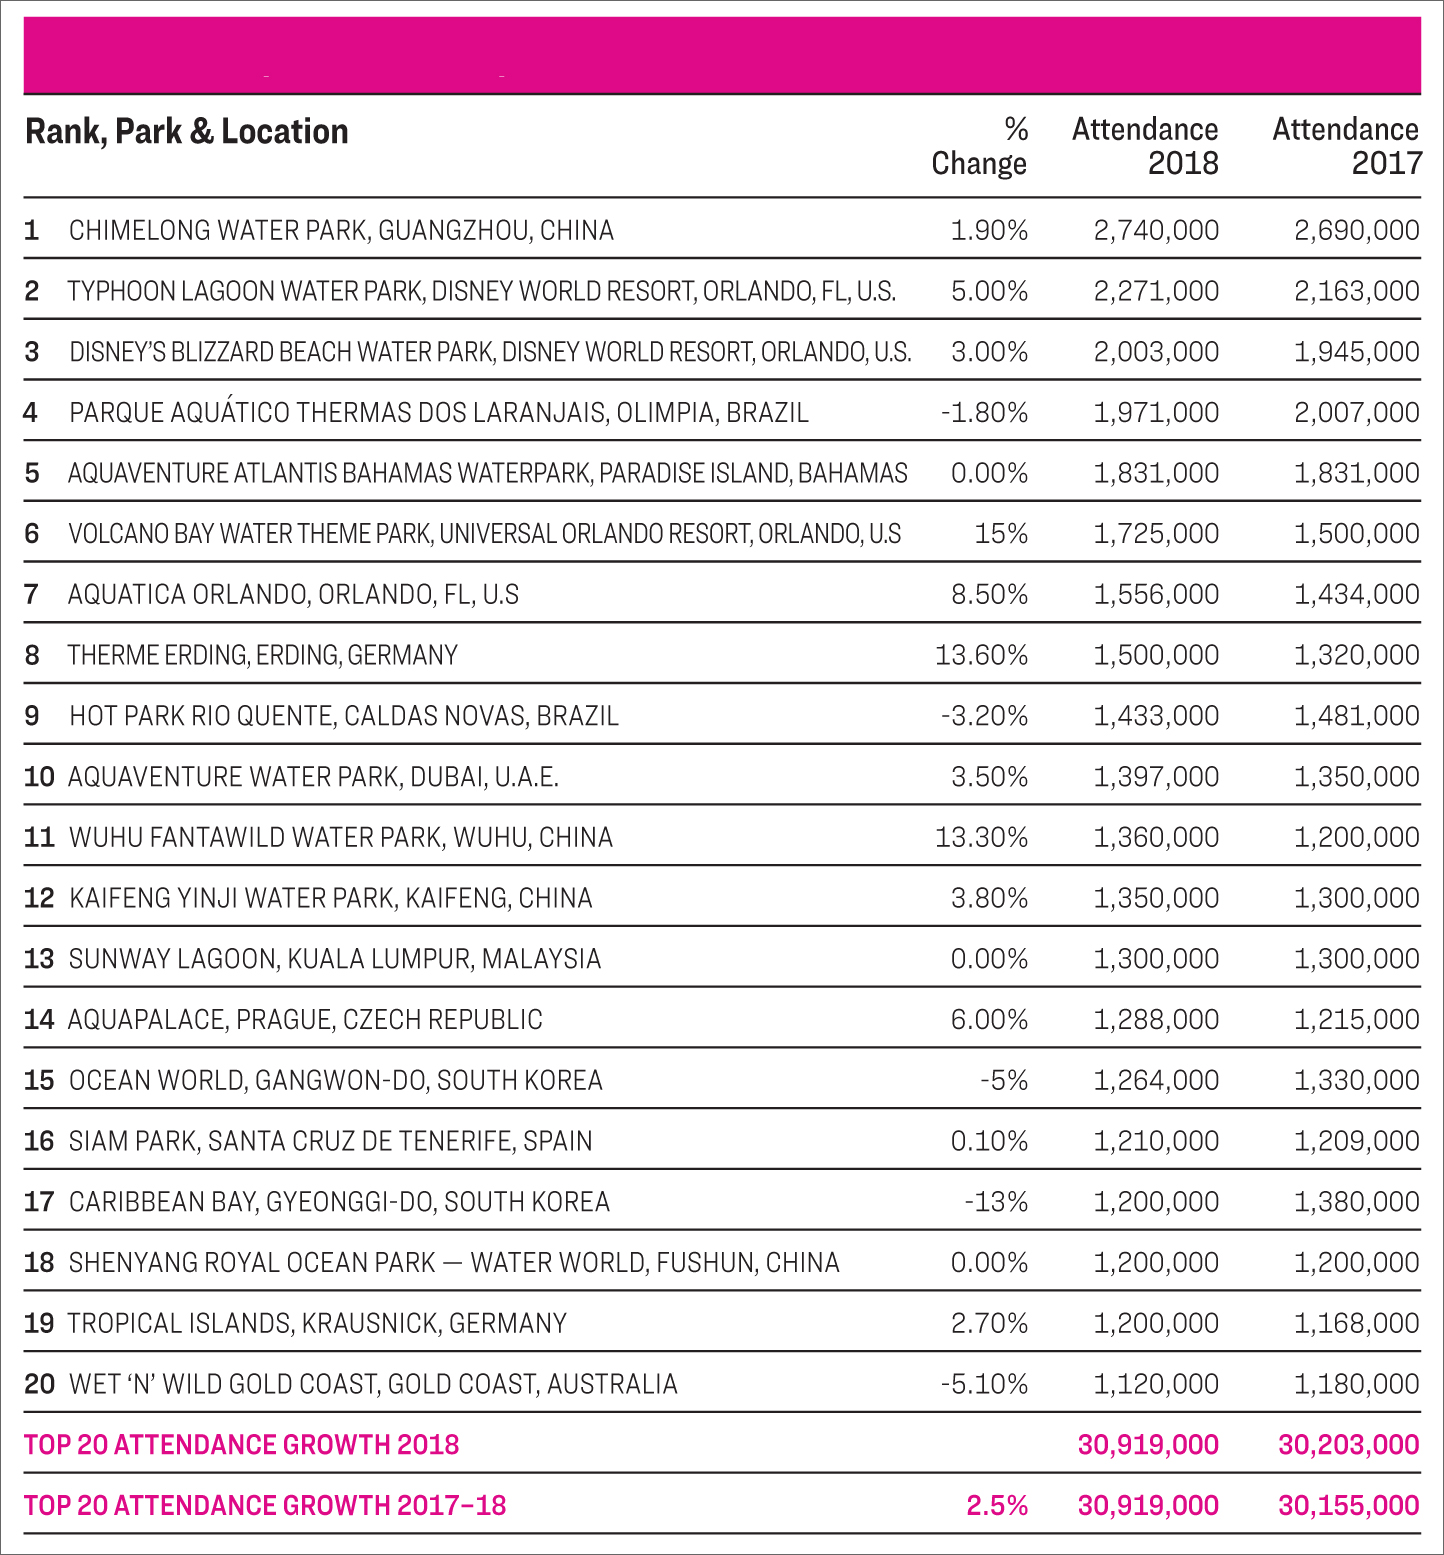
Attendance at major waterparks continues to grow, with nearly 31 million people visiting the top waterparks globally in 2018.
Waterpark attendance rose by 2.5 per cent last year, with 30.92 million people visiting one of the world’s top 20 most attended waterparks.
Chimelong continues to be the most visited, with 2.74 million people coming through its gates in 2018 – a 1.9 per cent increase on a record-breaking 2017.
Much like its theme park division, Disney had a strong showing in the waterparks sector, with attendance rises of 5 per cent and 3 per cent respectively at Typhoon Lagoon and Blizzard Beach, with the two waterparks in Orlando, Florida, ranking second and third on the list with 2.27 million and 2 million visitors.
There were significant gains for three theme parks on the list – Volcano Bay, Therme Erding and Wuhu Fantawild. Volcano Bay in Orlando enjoyed the largest gains, with an additional 225,000 visitors enjoying the waterpark – a 15 per cent increase year-on-year to 1.725 million visitors. Germany’s Therme Erding is Europe’s most-visited waterpark, with a 13.6 per cent rise in visitors to 1.5 million people. Wuhu Fantawild in China also saw a major rise, with its 1.36 million visitors for the year representing a 13.3 per cent rise in guests.
North America and the EMEA regions showed particularly strong growth in attendance, with a 5.8 per cent increase in North America to 16.237 million visitors, while EMEA rose by 6.7 per cent to 10.275 million visitors.
MUSEUMS
Temporary exhibitions and geopolitical changes continue to serve as key attendance drivers for museums in Europe, which remains the global market leader for attendance in the sector.
According to the report, museum attendance globally is primarily being driven by temporary exhibitions, facility improvements or expansions, external market factors, and improvements to competitive museums in the same market, with social media and special events now also starting to have an impact.
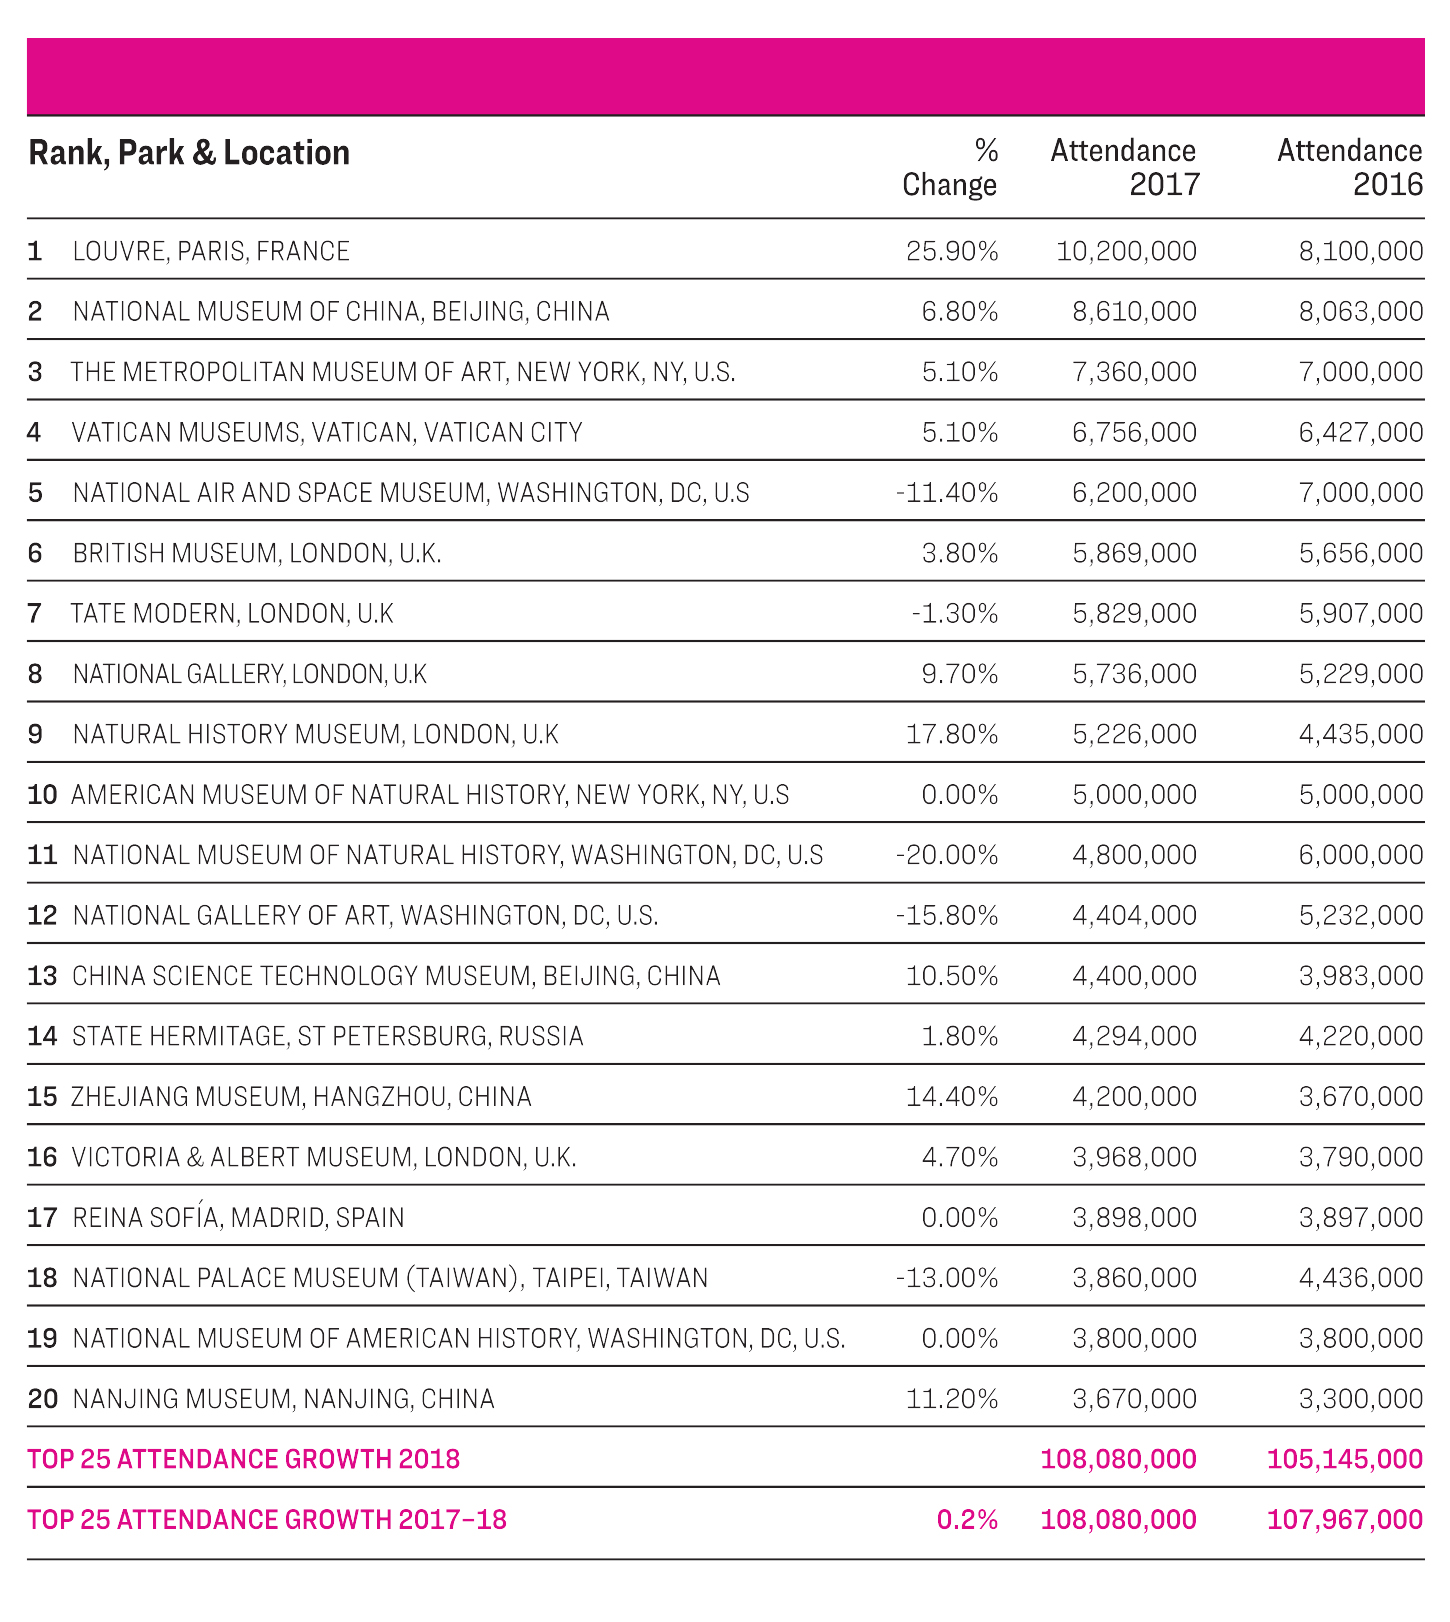
The Louvre in Paris, which was already the world’s top-attended museum, had a record-breaking year with 10.2 million visitors in 2018. The result is a significant increase on its previous attendance record reported in 2012 when the institution welcomed 9.7 million visitors. The attendance figures are particularly substantial for the Louvre and Paris, with the result representing a recovery from the museum’s 30 per cent downturn in 2017, a drop largely attributed to a plunge in tourism volumes during a time of unrest in the French capital.
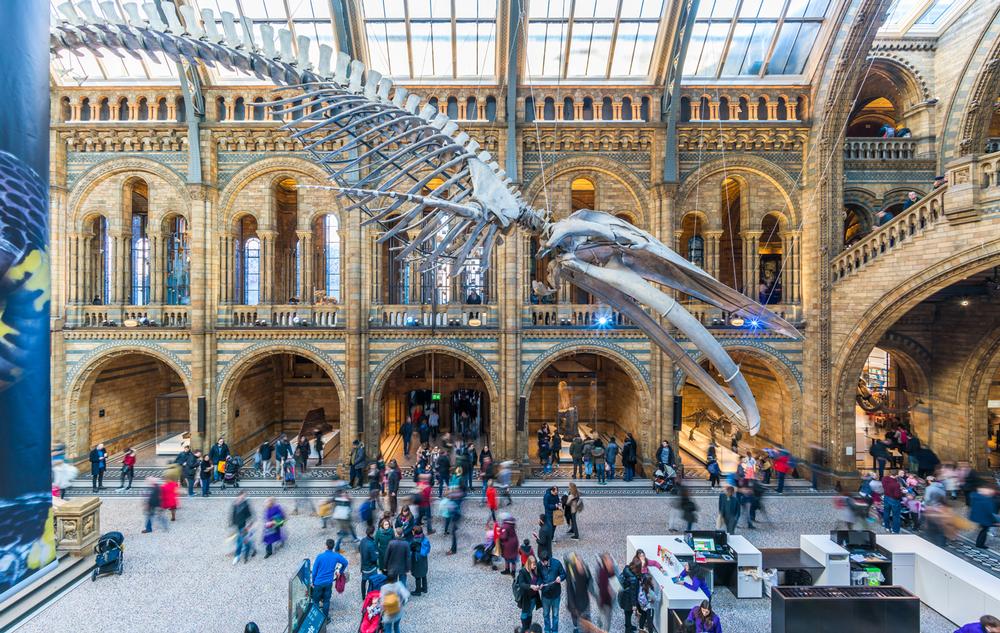
The Natural History Museum in London also enjoyed a record year, with an attendance surge of 17.8 per cent to 5.2 million visitors. According to the report, attendance was driven by the opening of the museum’s re-imagined main gallery – Hintze Hall – which features “Hope”, a 25-metre-long blue whale skeleton suspended from the ceiling. Other attendance boosters came from collaboration on events and products with leading IP, such as Dippy the Dinosaur, the Roald Dahl Story Company and Lego. The museum also introduced a new 357-seat traditional performance theatre.
The Metropolitan Museum of Art in New York is North America’s most visited museum, with an attendance rise of 5.1 per cent to 7.36 million visitors, taking the top spot for itself after drawing equal attendance in 2017 with Washington DC’s National Air and Space Museum, which experienced a significant decline primarily attributed to the month-long US government shutdown at the end of 2018, which majorly-affected the Smithsonian collection of museums.
Attendance for the top 20 museums worldwide was relatively flat, with 108.1 million combined visitors – an increase of 0.1 per cent on the previous year’s figures.
OBSERVATION EXPERIENCES
For the first time in the report’s history, the top 20 observation experiences worldwide have been tabled, with Tokyo’s Skytree the most attended at 6.4 million visitors.
The London Eye – third on the list – ranks as the most-visited wheel experience. Part of the Merlin cluster of attractions on the British capital’s South Bank, 3.9 million people took a ride on the attraction during the year.
For multi-use properties, New York’s Empire State Building ranks top, with 3.805 million visitors taking in the iconic structure’s views.
In Rio, Brazil, Christ the Redeemer is the only monument to make the top 20, with the world wonder welcoming 2.2 million visitors in 2018. Also in Rio, the Sugarloaf Cable Car – which moves between Praia Vermelha and the Sugarloaf Mountain – is the only designated ride to make the list, coming in 20th with 1.249 million riders.